Waveform viewer
A simulation can record every signal’s value over time in a waveform file (.vcd, or the smaller .fst), when the
testbench asks for it with $dumpfile and $dumpvars. A waveform viewer draws those values as waves, which is how
you see what the design did cycle by cycle. A Waveform Viewer run configuration (a named set of settings you start
with the Run button; see Run configurations) opens such a file in
Surfer or GTKWave, a separate application, so you
go from a run to its waves with one click instead of typing the viewer’s command.
Try it
Section titled “Try it”You need Surfer or GTKWave on your PATH (check with surfer --version or gtkwave --version in a terminal; to
install one, use brew install surfer on macOS or sudo apt install gtkwave on Debian or Ubuntu), and the
waves of the sample’s testbench: run the Try it of Verilator or
Icarus Verilog first, so that sim_tb.vcd is in the folder of the
sample project. The steps change no file. On a laptop, function keys such as Shift+F10 may need Fn. To start over, unzip the
sample project again.
-
Create a configuration. Choose Run | Edit Configurations…, click +, choose SystemVerilog Studio | Waveform Viewer and type
wavesin Name. In Waveform file, click the folder icon and choosesim_tb.vcdin the project folder (if it is not listed, cancel the chooser, choose File | Reload All from Disk and click the folder icon again). Leave Viewer executable empty and click OK. -
Run it. Select
wavesin the run-configuration drop-down in the top toolbar and click the green Run triangle (⌃R on macOS, Shift+F10 on Windows/Linux). The Run tool window shows the command line,…/surfer …/sim_tb.vcd(or…/gtkwave …/sim_tb.vcdwithout Surfer;…stands for the full paths on your machine), and the viewer’s window opens on the file. -
Add the signals. The recording holds the scope
sim_tb, the testbench, and inside itdut, the instance of the design’s top moduletop(top dut(clk, rst_n);intb/sim_tb.sv), withcount,done, the counter instanceu_counterand a few other entries (clk,rst_n, theg_laneblocks). A new file shows no waves until you add signals:- in Surfer, click
sim_tb, thendutin the scope list, thenclk,countanddonein the variable list; - in GTKWave, click
sim_tb, thendutin the tree at the top left, selectclk,countanddonein the signal list below it and click Append.
- in Surfer, click
-
Read the result.
countstays 0 for one more clock after the reset (the counter first leaves its idle state), then goes up by one each clock cycle (10 ns) from 35 ns and stops at 20 (shown as14when the viewer displays hexadecimal), anddonegoes high at 225 ns (225000 ps; the viewer may show either), the time thePASS: … 225000line printed. It stays high until the recording ends at 245 ns, when the testbench stops. With Icarus Verilog’s recording,countanddonestart unknown (x, drawn in red) until the first clock edge at 5 ns.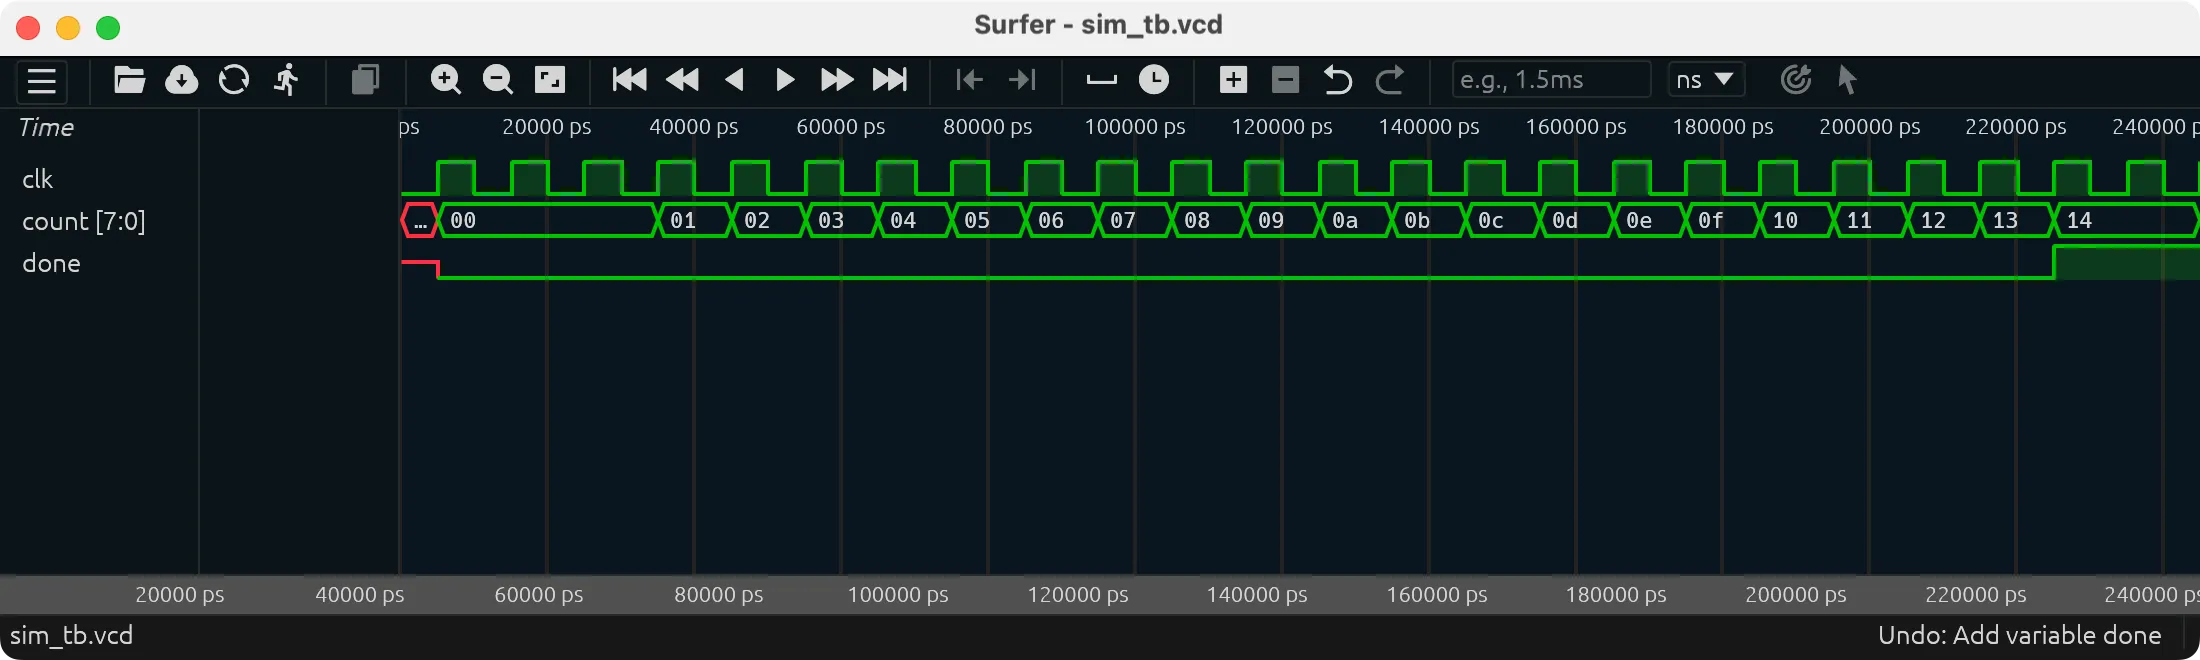
To clean up, close the viewer, delete sim_tb.vcd (right-click it in the Project tool window, Delete), and
remove the configuration: select it in Run | Edit Configurations… and click the minus button. Then clean up what
the Verilator or Icarus Verilog page left: obj_dir/ or
sim.vvp, and its configuration.
How it works
Section titled “How it works”The configuration runs viewer [options] file in the folder of the waveform file.
Settings
Section titled “Settings”Open the configuration with Run | Edit Configurations… and select it in the list on the left.
| Setting | Meaning |
|---|---|
| Waveform file | The .vcd, .fst or other file the viewer opens. A relative path starts at the project directory. |
| Viewer executable | Empty: Surfer if it is on the PATH, else GTKWave. Otherwise a path (a relative one starts at the project directory) or a name to look up on the PATH, e.g. gtkwave to use GTKWave when both are installed. Any viewer that takes the file as its last argument works. |
| Viewer options | Go before the file, e.g. --save session.gtkw for GTKWave: it loads that session file (the signals you added, the zoom) if it exists; GTKWave writes it with File | Write Save File. A relative name starts in the folder of the waveform file, where the viewer runs. |
If it doesn’t work
Section titled “If it doesn’t work”| You see | Likely cause | What to do |
|---|---|---|
| The command line shows, but no viewer window opens, or the run ends with an exit code other than 0 | The viewer failed to start | Read the viewer’s message in the Run tool window; run the same command in a terminal; or enter the viewer’s full path in Viewer executable |
| The viewer opens, but no waves are drawn | A new file shows no signals until you add them | Add count and done from sim_tb › dut (see step 3) |
The configuration dialog says Waveform file not found: … |
The simulation did not write it, or it is in another folder | Run the simulation first; with Verilator, Verilator options need --trace (see Verilator); the file is written in the simulation’s working directory |
The dialog says No waveform viewer (surfer, gtkwave) on the PATH: … |
Neither Surfer nor GTKWave is on the PATH | Install one, or enter the viewer’s path in Viewer executable |
The same message, although surfer works in a terminal |
The IDE does not have your shell’s PATH | Enter the full path in Viewer executable (which surfer in a terminal gives it, for example /opt/homebrew/bin/surfer), or start the IDE from a terminal |
See also Troubleshooting.
Limitations
Section titled “Limitations”- Run only: the configurations cannot be debugged.
- Tested on macOS and Linux; Windows is untested.
More in Known limitations: Run configurations.
Related
Section titled “Related”- Verilator, Icarus Verilog: run a simulation that records waves.
- Run configurations: the Run tool window and stopping a run.